How only 2 parameters of PostgreSQL reduced anomaly of Jira Data Center nodes
Hello community,
Gonchik Tsymzhitov is in touch. Today, I would like to share with you a short story about postgresqltuner.pl in usage.
So from previous articles I hope you configured the PostgreSQL server and postgresqltuner.pl.
After executing command,
./postgresqltuner.pl --ssd
for ssd disks server.
You can see like this output:
postgresqltuner.pl version 1.0.1
[OK]      I can invoke executables
Connecting to /var/run/postgresql:5432 database template1 as user 'postgres'...
[OK]      The user account used by me for reporting has superuser rights on this PostgreSQL instance
=====  OS information  =====
[INFO]    OS: linux Version: 5.4.17-2036.102.0.2.el8uek.x86_64 Arch: x86_64-linux-thread-multi
[INFO]    OS total memory: 41.03 GB
[OK]      vm.overcommit_memory is adequate: no memory overcommitment
[INFO]    Running under a vmware hypervisor
[INFO]    Currently used I/O scheduler(s): mq-deadline
=====  General instance informations  =====
-----  PostgreSQL version  -----
[OK]      Upgrade to the latest stable PostgreSQL version
-----  Uptime  -----
[INFO]    Service uptime: 43d 19h 43m 27s
-----  Databases  -----
[INFO]    Database count (except templates): 1
[INFO]    Database list (except templates): jiradb
-----  Extensions  -----
[INFO]    Number of activated extensions: 1
[INFO]    Activated extensions: plpgsql
[WARN]    Extension pg_stat_statements is disabled in database template1

….

-----  Huge Pages  -----
[WARN]    No Huge Pages available on the system

-----  Checkpoint  -----
[WARN]    checkpoint_completion_target (0.7) is low
[INFO]    Given those settings PostgreSQL may (depending on its workload) ask the kernel to write (to the storage) up to 4.00 GB
in a timeframe lasting 210 seconds <=> 19.50 MB bytes/second during this timeframe.
 You may want to check that your storage is able to cope with this, along with all other I/O (non-writing queries, other software...)
operations potentially active during this timeframe.
If this seems inadequate check max_wal_size, checkpoint_timeout and checkpoint_completion_target
-----  Storage  -----
[OK]      fsync is on
[OK]      synchronize_seqscans is on
...
[OK]      This is very good (if this PostgreSQL instance was recently used as it usually is, and was not stopped since)
=====  Configuration advice  =====
-----  checkpoint  -----
[MEDIUM] checkpoint_completion_target is low.  Some checkpoints may abruptly overload the storage with write commands for a long time, slowing running queries down.  To avoid such temporary overload you may balance checkpoint writes using a higher value
-----  extension  -----
[LOW] Enable pg_stat_statements in database template1 to collect statistics on all queries (not only those longer than log_min_duration_statement)
-----  planner  -----
[MEDIUM] Set random_page_cost=seq_page_cost on SSD storage
-----  version  -----
[LOW] Upgrade to the latest stable PostgreSQL version
After reading quite interesting docs (forks, EDB Postgres: Top Performance Related Parameters, tuning WAL, WAL in Runtime ) .
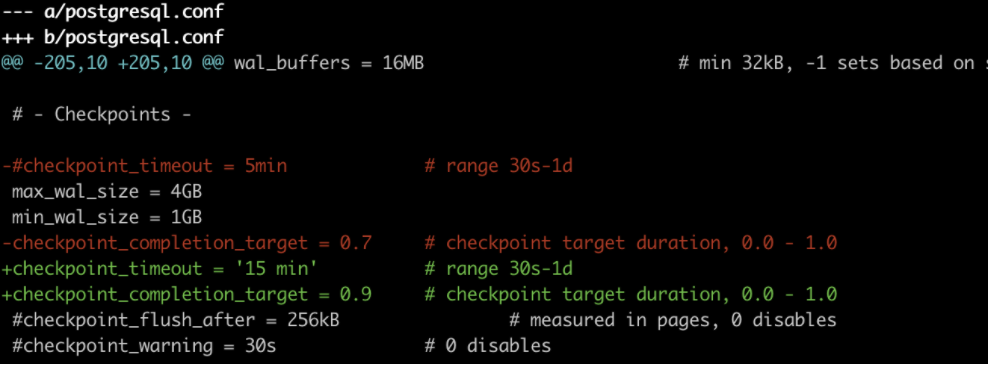
Made the next changes checkpoint_timeout and checkpoint_completion_target:
Then after reloading:
# systemctl reload postgresql-11.service
# ./postgresqltuner.pl  --ssd
In config advice, now we can see better summary.
Also, we can check via next command in psql:
postgres=#  select name, setting from pg_settings where name like '%wal_size%' or name like '%checkpoint%' order by name;
             name             | setting
------------------------------+---------
 checkpoint_completion_target | 0.9
 checkpoint_flush_after       | 32
 checkpoint_timeout           | 900
 checkpoint_warning           | 30
 log_checkpoints              | off
 max_wal_size                 | 4096
 min_wal_size                 | 1024
(7 rows)
Once after that anomaly disappears, as IO goes is predictable.
Hope that parameter will be helpful.
Cheers,
Gonchik Tsymzhitov


Nice reading, I love your content. This is really a fantastic and informative post. Keep it up and if you are looking for Data Destruction Service Washington Dc then visit IT Recycling Solution.
ReplyDelete