How do you analyze GC logs, thread dumps and head dumps?
Hi awesome community!
In this article, I would like to describe the one of the toolset (service) for the analyze some problems on different Java-based instances, of course, as Atlassian administrator, first of all, it is Atlassian applications.
First, of the all, I want to say many thanks to the Atlassian Ecosystem developers for the providing Troubleshooting and Support tools. Because a lot of users can provide easy support.zip with thread dumps and GC logs if it is enabled (since 7.4 it is pre-populated in the configs). By the way, you can take a thread dump yourself using the jps ( or old way ps aux | grep java) and jstack. I hope these useful articles will help you (1, 2, 3, 4, 5).
Well, let's back to our steps about GC, if you click and read the KB about GC logging then you will find already interesting tools GC viewer, Visual GC, but it will be good if we have the same thing in the online and with ML (Machine Learning).
Hence, you can use these online tools which will provide for you easily some view of your system and you can automate it by public REST API.
- https://gceasy.io/
- https://heaphero.io/ - a sister project
- https://fastthread.io/ - a sister project
* All 3 links work as one.
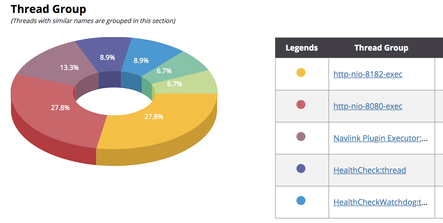
After uploading you will easier grouping and how threads changed in a different time period.
For the GC logs, you can see like these parameters
And finally, I like to see a conclusion like this
This article is based on the many questions to me from an online community and AUG members, like how do you review GC logs in short time?
Hope it helps and you will earn capacity for other awesome tasks.
P.S. I hope someone will provide more methods (in atlassian-python-api) for better automate process through support tools instead of bash scripts :) I'll be happy.
P.S.S. And we monitoring by prometheus and exporter more detail info you can read in article "Monitoring of Atlassian applications with Prometheus"
P.S.S. Also, you can do it by Zabbix, nagios through JMX.
Thanks for your attention.
Cheers,
Gonchik Tsymzhitov


Comments
Post a Comment