How to easily decrease the heap size for your server product?
- Get link
- X
- Other Apps
Hi, community!
I would like to share my experience using the String deduplication functionality in JVM.
A suggestion was based on community questions and GC logs provided by members, where I have not seen that feature on JVM parameters.
Disclaimer, as usual, everything should be tested in the test-environment first.
My use case was started from the next situation, if you have a system where you can not extend RAM easier and don't want to use as a swap file.
Well let's start, as you know that a string deduplication feature added into Java 8 update 20 (it is super old release, 2014).
All technical info you can in JEP-192 - http://openjdk.java.net/jeps/192
You can enabled in G1 GC with next parameters:
-XX:+UseG1GC -XX:+UseStringDeduplication -XX:+PrintStringDeduplicationStatistics
UseStringDeduplication(bool) - Enable string deduplicationPrintStringDeduplicationStatistics(bool) - Print detailed deduplication statisticsStringDeduplicationAgeThreshold(uintx) -Stringobjects reaching this age will be considered candidates for deduplication
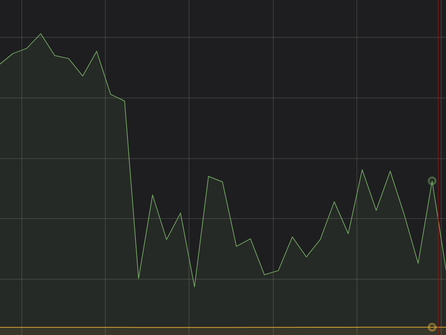
Let's see the results on monitoring:
The yellow line is non-heap memory usage, the green is heap memory.
In this case, I especially removed the value of GB. Because that optimisation is really individual for every instance. Because we are using 3rd-party plugins and own apps. Where all those parameters reflected to value and also, some plugins (apps) starting to be better after implementing the DC compatibility requirements. (Thanks for that Atlassian).
But the last statistics you can read in this stats output, reading that info I decreased in our 3rd party app a String usage.
2019-03-03T22:32:49.221+0100: 843349.318: [GC concurrent-string-deduplication, 15.6M->82.4K(15.5M), avg 78.5%, 0.1523212 secs]
[Last Exec: 0.1523212 secs, Idle: 11.6095757 secs, Blocked: 2/0.0201580 secs]
[Inspected: 184339]
[Skipped: 0( 0.0%)]
[Hashed: 136198( 73.9%)]
[Known: 30( 0.0%)]
[New: 184309(100.0%) 15.6M]
[Deduplicated: 182894( 99.2%) 15.5M( 99.5%)]
[Young: 182894(100.0%) 15.5M(100.0%)]
[Old: 0( 0.0%) 0.0B( 0.0%)]
[Total Exec: 22129/365.6814278 secs, Idle: 22129/842910.6783849 secs, Blocked: 14649/68.0063332 secs]
[Inspected: 434930188]
[Skipped: 2( 0.0%)]
[Hashed: 270134906( 62.1%)]
[Known: 2133448( 0.5%)]
[New: 432796738( 99.5%) 27.6G]
[Deduplicated: 405747212( 93.8%) 21.6G( 78.5%)]
[Young: 213685766( 52.7%) 12.4G( 57.5%)]
[Old: 192061446( 47.3%) 9423.7M( 42.5%)]
[Table]
[Memory Usage: 258.9M]
[Size: 8388608, Min: 1024, Max: 16777216]
[Entries: 8146001, Load: 97.1%, Cached: 371239, Added: 28627150, Removed: 20481149]
[Resize Count: 13, Shrink Threshold: 5592405(66.7%), Grow Threshold: 16777216(200.0%)]
[Rehash Count: 0, Rehash Threshold: 120, Hash Seed: 0x0]
[Age Threshold: 3]
[Queue]
[Dropped: 0]
[GC concurrent-string-deduplication, deleted 1 entries, 0.0000053 secs]
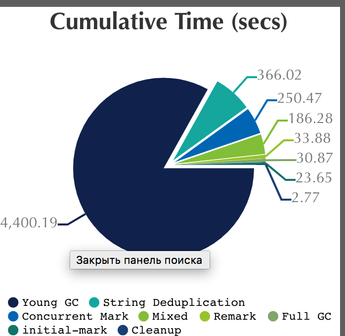
Well, I hope you have concerns related to time for execute that functionality:
Where we can see that function works often. but it is interesting how much need to complete 1 time review string deduplication.
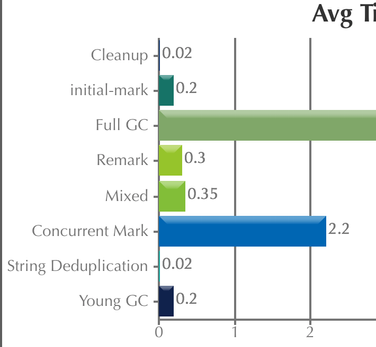
As you see it fastest phase of G1 GC.
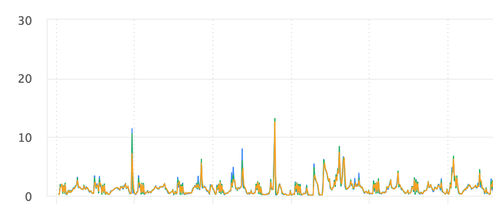
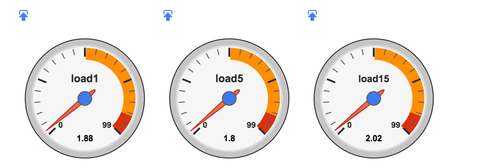
Let's see the situation of with CPU, because we need to pay to CPU :).
In my situation, everything is ok. Also, I see my CPU is wasting time ;)
Conclusion:
If you want to balance CPU and RAM usage for your JVM, by string deduplication feel free to use it. Because it is an easy to win.
I hope that info was interesting for you. If It is, I will share the next some parameters I use for one of my env.
Cheers,
Gonchik Tsymzhitov
- Get link
- X
- Other Apps
Comments
Post a Comment