So when we need to adjust configures for RDBMS? Or DB Performance analysis tools through lazy eyes
Hi, the community!
Today, I would like to speak about configuration for the RDBMS (like MySQL, PostgreSQL, MS SQL, Oracle) and I will be happy to read your feedback. That article will have 4 parts (overview, use cases, specific products, deadlock).
Many times as I see into different environments, installations with Atlassian Suite, as most of the configs are defaults. Therefore I want to share with small tips and tricks, which is used by me for a long time.
Based on that maybe someone will be interested in the short links, for first the configuration before starting to go deep into ANALYZE, EXPLAIN utils.
Let’s start it.
- PostgreSQL
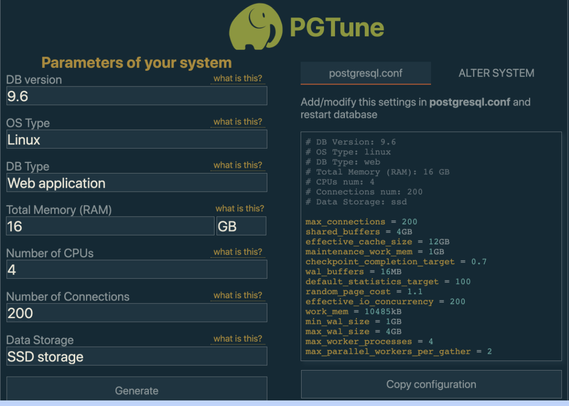
My favorite tool is https://pgtune.leopard.in.ua/#/
Via that service, I can easy to set the first parameters. I do recommend you check the DB pool connections in dbconfig.xml (KB of dbconfig.xml) + add a few extra connections (typically I add +10 it depends on replication/bi/other connections), otherwise, you can’t log in.
You can see one of my server setups.
References:
- https://pgtune.leopard.in.ua/#/
- https://wiki.postgresql.org/wiki/Performance_Optimization
- https://postgrespro.ru/docs/postgresql/9.6/performance-tips#
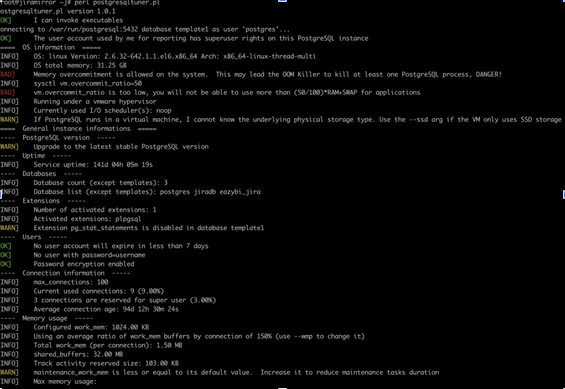
Second favorite tool is postgresqltuner.pl (https://github.com/jfcoz/postgresqltuner).
[root@jiramirror ~]# wget -O postgresqltuner.pl postgresqltuner.pl
[root@jiramirror ~]# yum install -y perl-DBD-Pg
[root@jiramirror ~]# perl postgresqltuner.pl
2.MySQL (and other forks Percona, Galera, MariaDB)
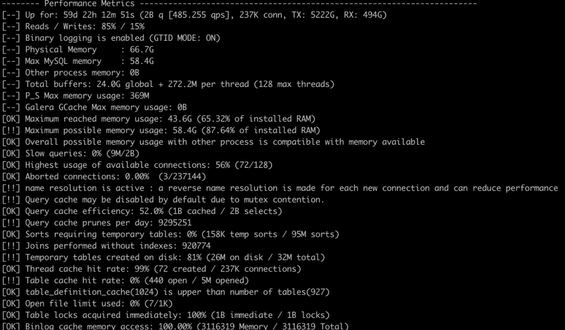
So about the MySQL side, I must write about legendary tools mysqltuner.pl (https://github.com/major/MySQLTuner-perl)
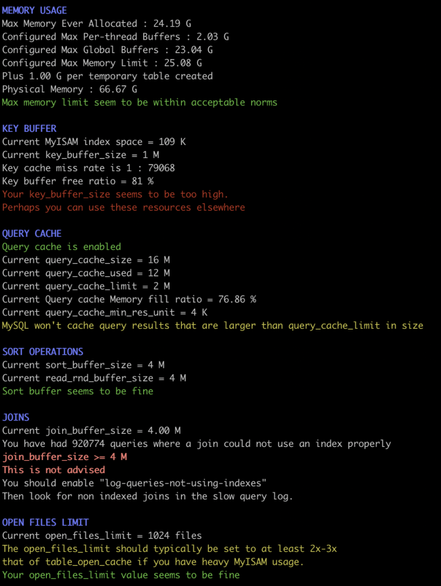
On the below screenshots you can see some of my metrics. As that tool in a short time provide you a full overview of that moment.
Also, I do recommend read recommendations carefully, cause them will help you :)
And another my favourite tool is tuning-primer.sh
https://github.com/BMDan/tuning-primer.sh
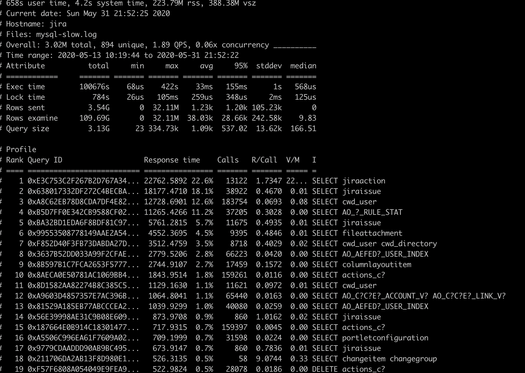
I use both tools before going to investigate deeply slow queries.
As for slow queries I use pt-query-digest
https://www.percona.com/doc/percona-toolkit/LATEST/pt-query-digest.html
I will describe next time to find some problematic plugin queries in your system.
3. Oracle
For the Oracle, I did not often do the investigation of the bottlenecks as most of problems fixed by the Spotlight. (https://www.quest.com/solutions/database-performance-monitoring/)
4. MS SQL Server
For the MS SQL server is the same mostly, I used the general performance counters and a few tips and tricks
- https://docs.microsoft.com/sql/relational-databases/system-dynamic-management-views/sys-dm-os-performance-counters-transact-sql
- https://www.mssqltips.com/sql-server-tip-category/9/performance-tuning/
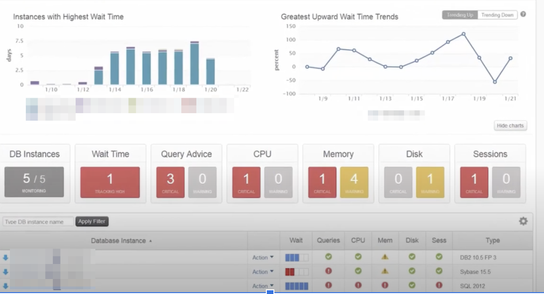
So as a lazy person, I use sometimes the SolarWinds Database Performance Analyzer (https://www.solarwinds.com/database-performance-analyzer).
Conclusion:
First of all, I want to say thank you for the improving your ecosystem and Atlassian team for the improving DB schema each release for the performance perspectives.
I will be happy if you share your favourite tools/services/products for the RDBMS performance review, analysis, reporting etc.. Also, I hope you saw I like most open-source tools, as proprietary tools optimized by some specific products easy.
If you are interested of some tips and tricks around tuning RDBMS I can share my experience and use cases and do a small investigation on your environments if you want.
But please, mark the continuous monitoring. measuring will help you to have a tuned ecosystem.
Cheers,
Gonchik Tsymzhitov

Comments
Post a Comment