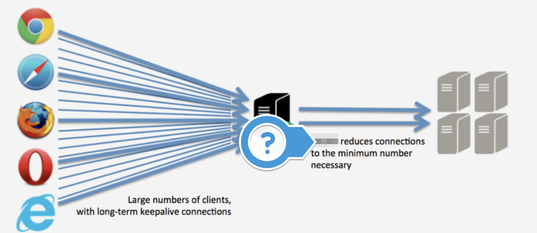
Let's customize logging of reverse proxy or time to check response time of application in real time
Hi wonderful community!
So at the moment, a lot of companies understood WFH (working from home) is efficient for the productivity and services should much faster. Hence I will share typical use cases for investigating the slowness because the first thing is to measure the response time:
Today I would like to share some easy trick related to the configuration related to the reverse proxy which is used by the mostly on-premises setup of Atlassian product.
- Let’s start from popular nginx:
$upstream_response_time - keeps time spent on receiving the response from the upstream server; the time is kept in seconds with millisecond resolution. Times of several responses are separated by commas and colons like addresses in the $upstream_addr variable.
Detailed info: https://nginx.org/en/docs/http/ngx_http_upstream_module.html
$request_time - request processing time in seconds with a milliseconds resolution; time elapsed between the first bytes were read from the client and the log write after the last bytes were sent to the client.
Detailed info: https://nginx.org/en/docs/http/ngx_http_log_module.html
Actually, I used 2 additional formats with next variables appmon, appmon_detailed:
http {

...

log_format  main '$remote_addr - $remote_user [$time_local] "$request" '

                      '$status $body_bytes_sent "$http_referer" '

                      '"$http_user_agent" "$http_x_forwarded_for"';

log_format appmon '[$time_local] $remote_addr - $remote_user "$request" $status $body_bytes_sent $request_length "$http_referer" "$http_user_agent" $request_time $upstream_response_time';

log_format appmon_detailed '[$time_local] $remote_addr - $remote_user "$request" $status $body_bytes_sent $request_length "$http_referer" "$http_user_agent" $request_time $upstream_response_time $request_body';

server {

     ....

     access_log /var/log/nginx/jira.example.com.ssl.access.log appmon;

     …
So for how we can investigate the logs, if you don’t have log analyzer yet? Please, check the next command which is monitor query longer than 10sec.
tail -f -n10000 /var/log/nginx/jira.example.com.ssl.access.log | awk '$NF>10'
As result you can see result like this, e.g. is’t problem with one of gadget:
[08/Apr/2020:20:24:40 +0200] 10.10.10.236 - - "GET /rest/gadget/1.0/favfilters?showCounts=true&_=1586370267431 HTTP/2.0" 499 0 66 "https://jira.example.com/secure/Dashboard.jspa" "Mozilla/5.0 (Windows NT 6.1; Win64; x64) AppleWebKit/537.36 (KHTML, like Gecko) Chrome/80.0.3987.163 Safari/537.36" 11.544 11.543
Link to exporter Prometheus: https://github.com/nginxinc/nginx-prometheus-exporter
- httpd (Apache HTTP server)
%D - The time taken to serve the request, in microseconds.
or you can use that one
%T - The time taken to serve the request, in seconds.
Detailed info: http://httpd.apache.org/docs/current/mod/mod_log_config.html
And you can adjust the log format in httpd.conf usign the below example:
LogFormat "%h %l %u %t \"%r\" %>s %b \"%{Referer}i\" \"%{User-agent}i\" %D"Link to exporter: https://github.com/Lusitaniae/apache_exporter
- HAProxy
Reference: https://www.haproxy.com/blog/exploring-the-haproxy-stats-page/
If you do monitoring let’s use that exporter https://github.com/prometheus/haproxy_exporter
- Varnish
that’s app pretty awesome software to do caching, next time I will how to do for the one of software of Atlassian suite.
- https://feryn.eu/blog/varnishlog-measure-varnish-cache-performance/
- https://book.varnish-software.com/4.0/chapters/Examining_Varnish_Server_s_Output.html
- Link to exporter: https://github.com/jonnenauha/prometheus_varnish_exporter
Hope it helps.
I will be happy if you add some comments and I will be happy if you provide what kind of reverse proxy do you use.
Cheers,
Gonchik Tsymzhitov

Comments
Post a Comment