So time to reduce latency using JVM option, or history about random vs urandom differences
Hi,
Sometimes, I need to reduce latency of Java app, especially, of Atlassian Suite.
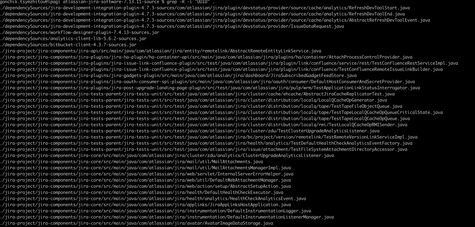
As we know Jira, use UUID generation for many approaches, like integration with other Atlassian products. as example, I made grepping for the 7.13.x release sources for the UUID references
So we can optimize a small option in the java.security,
which is located in Java 8.
$JAVA_HOME/lib/security/java.security
for Java 11:
$JAVA_HOME/conf/security/java.security
We can change to
securerandom.source=file:/dev/urandom
instead of
securerandom.source=file:/dev/random
I do recommend you to read pages linked in References.
Benchmarks
Before making change, let’s do a few benchmarks.
I used that one (https://github.com/ajbrown/uuid-generator-benchmark)
on the
Linux version 3.10.0-1127.el7.x86_64 (mockbuild@x86-034.build.eng.bos.redhat.com) (gcc version 4.8.5 20150623 (Red Hat 4.8.5-39) (GCC) ) #1 SMP Tue Feb 18 16:39:12 EST 2020
Results:
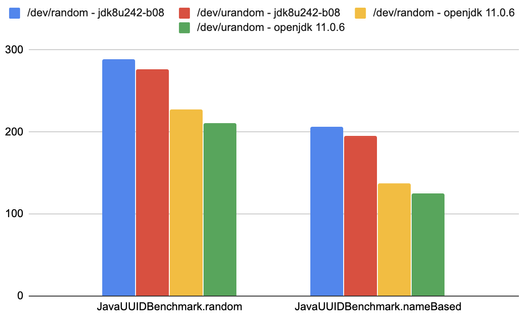
/dev/random - jdk8u242-b08
# Run complete. Total time: 00:02:42

Benchmark                           Mode Cnt Score Error Units
EAIOBenchmark.timeAndEthernetBased    ss 100 83.127 ± 4.634 ms/op
JUGBenchmark.nameBased                ss 100 93.167 ± 8.612 ms/op
JUGBenchmark.random                   ss 100 198.932 ± 12.170 ms/op
JUGBenchmark.timeAndEthernetBased     ss 100 93.234 ± 7.041 ms/op
JUGBenchmark.timeBased                ss 100 92.625 ± 8.496 ms/op
JavaUUIDBenchmark.nameBased           ss 100 206.336 ± 36.419 ms/op
JavaUUIDBenchmark.random              ss 100 288.553 ± 25.660 ms/op
/dev/random - openjdk 11.0.6
# Run complete. Total time: 00:02:29

Benchmark                          Mode Cnt Score Error Units
JUGBenchmark.nameBased               ss 100 96.258 ± 13.504 ms/op
JUGBenchmark.random                  ss 100 199.150 ± 16.954 ms/op
JUGBenchmark.timeAndEthernetBased    ss 100 88.397 ± 7.082 ms/op
JUGBenchmark.timeBased               ss 100 87.346 ± 7.794 ms/op
JavaUUIDBenchmark.nameBased          ss 100 137.397 ± 29.385 ms/op
JavaUUIDBenchmark.random             ss 100 227.381 ± 20.810 ms/op
/dev/urandom - jdk8u242-b08
# Run complete. Total time: 00:02:38

Benchmark                           Mode Cnt Score Error Units
EAIOBenchmark.timeAndEthernetBased    ss 100 86.825 ± 5.337 ms/op
JUGBenchmark.nameBased                ss 100 92.620 ± 8.273 ms/op
JUGBenchmark.random                   ss 100 196.341 ± 13.258 ms/op
JUGBenchmark.timeAndEthernetBased     ss 100 90.217 ± 8.017 ms/op
JUGBenchmark.timeBased                ss 100 85.742 ± 6.362 ms/op
JavaUUIDBenchmark.nameBased           ss 100 194.917 ± 31.265 ms/op
JavaUUIDBenchmark.random              ss 100 276.298 ± 26.933 ms/op
/dev/urandom - openjdk 11.0.6
# Run complete. Total time: 00:02:19

Benchmark                          Mode Cnt Score Error Units
JUGBenchmark.nameBased               ss 100 88.819 ± 10.755 ms/op
JUGBenchmark.random                  ss 100 179.651 ± 12.303 ms/op
JUGBenchmark.timeAndEthernetBased    ss 100 81.948 ± 4.981 ms/op
JUGBenchmark.timeBased               ss 100 82.964 ± 4.402 ms/op
JavaUUIDBenchmark.nameBased          ss 100 124.635 ± 25.655 ms/op
JavaUUIDBenchmark.random             ss 100 210.720 ± 16.614 ms/op
Conclusion:
The result of benchmarks shows reduced latency results, but not a big, because I did microbenchmark, which is shows exact function for the big system you can see a good improvements.
I like philosophy of storing config in the environment or on related CI/CD tools.
Hence you can use the JVM parameter in setenv.sh (setenv.bat) like this
-Djava.security.egd=file:///dev/urandom
References:
https://www.ibm.com/support/pages/slow-performance-linux-vm-701-and-prior-releases
https://quotidian-ennui.github.io/blog/2012/06/15/slow-java-crypto-performance-on-linux/
Cheers,
Gonchik Tsymzhitov


Comments
Post a Comment