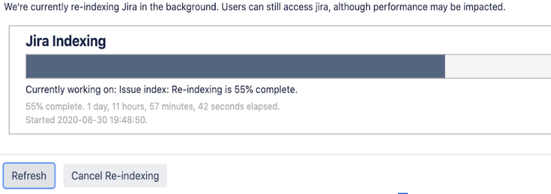
The story about how to improve the background indexing Lucene job for Jira in one shot (just non-standard way)?
Holidays are the time to move your notes into small stories and small finalized articles.
Based on that I will share a series of articles improving the performance of indexing Lucene of Jira. (such as testing the disks, checking the health of VM, filesystem, ramdisk vs SSD, RDBMS tuning and connectivity, and of course, addons, custom fields, calculated fields as well)
Let’s start from the file system level because it was non-standard improvement.
So who works with on-prem Jira, still meet on large instances with the long background reindexing job.
Before the experiment, we had the next result of background reindexing for the ~3 mln tickets + daily ~2k tickets, 1.2k custom fields, ~20k+ users.
System information before improvements:
- VMWare cluster
- NetApp
- SSD read cache + SAS for application, full SSD for RDBMS
- Oracle Linux 7
- Filesystem: XFS
- Java 11
- Jira 8.5.2
- GC strategy as usual Shenandoah GC
- MySQL 5.6.x cluster (master-slave)
- Monitoring prometheus + grafana
Access for the first step I had only SSH access to the system and no access to the Jira as application (GUI). Because waiting for the approvals and additional test env for the change on the application level.
So I started from that tool https://github.com/AUGSpb/atlassian-support-benchmark , because it includes percentiles :) Results were acceptable.
So the next step is to check /var/log/messages and other levels.
Because I had more than 60,000ms than Brendon Gregg, but I used his technique to check.
One interesting option was iostat.
# iostat -xz 1

avg-cpu:  %user   %nice %system %iowait  %steal   %idle
                    8.73    0.00    0.28    0.05    0.00   90.94
Device:            tps    kB_read/s    kB_wrtn/s    kB_read    kB_wrtn
sda              74.84       181.73      1133.16 3530350052 22013754947
sdb              11.68       105.15       211.81 2042647649 4114862996
sdc               0.42         6.46         6.54  125413861  127003521
dm-0              0.14         0.18         0.38    3513884    7325080
dm-1             75.26       181.54      1132.77 3526794066 22006130096
dm-2             12.06       105.15       211.81 2042646465 4114862996
dm-3              0.44         6.46         6.54  125409921  127003521
The problem was interesting, the logical volume was slow, but the physical volume faster, of course, we need to pay attention to resource consumption. And during indexing, the results were the same.
So the problem was with XFS fragmentation. Of course, many administrators will say we met with that on Windows with NTFS file system, and on Linux impossible. So no worry you can meet with that :)
Detected via next command:
# xfs_db -c frag -r /dev/mapper/vg_jira-jira
actual 167812, ideal 116946, fragmentation factor 30.31%
Note, this number is largely meaningless.
Files on this filesystem average 1.43 extents per file
Online fix on prod env:
# xfs_fsr /dev/mapper/vg_jira-jira
/jira start inode=0
Double check after a few days:
# xfs_db -c frag -r /dev/mapper/vg_jira-jira
actual 34173, ideal 33338, fragmentation factor 2.44%
Note, this number is largely meaningless.
Files on this filesystem average 1.03 extents per file
References:
I hope that links will help you to indicate your problem proactively.
https://www.mythtv.org/wiki/Optimizing_Performance
https://support.microfocus.com/kb/doc.php?id=7014320
Conclusion:
As a result, improved latency till 17%, background reindexing in one thread of that instance ~73h vs ~49h.

Comments
Post a Comment