Overview and practical use cases with open source tracing tool for Java Apps. In-house devs
This example comes from internal development, in fact, this is often the case with applications from the marketplace.atlassian.com.
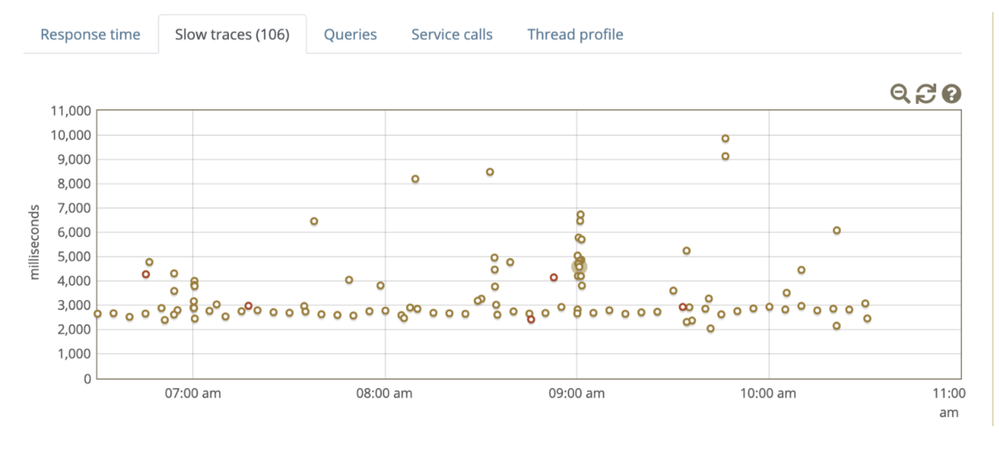
One morning, looking at the charts, I saw how slow and repetitive the requests are, which often indicate automation and integration.
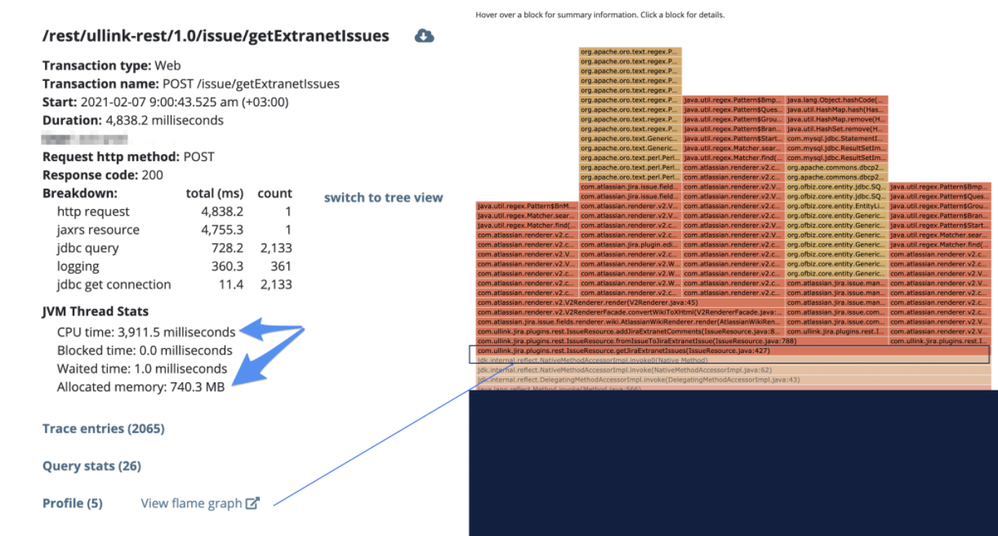
Having clicked on the requests, I saw that almost all of them refer to the rest endpoint below.
And right away by clicking on the flamegraph, we can easily find the roots, all these heavy requests and allocated memory.
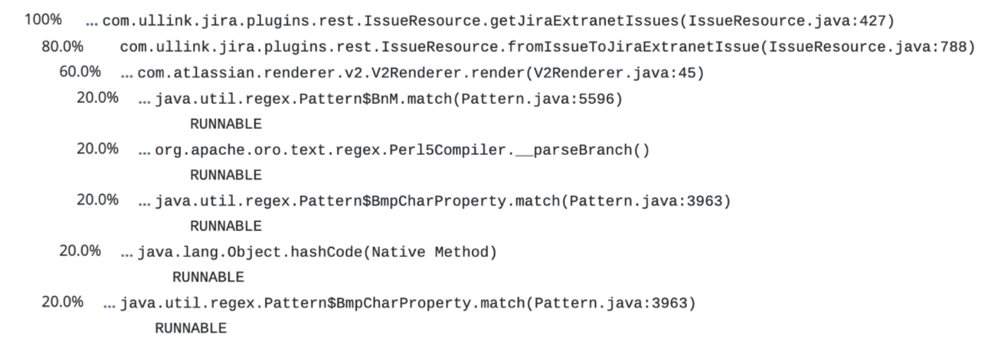
Then I got a trace to the method, and I see that 80 percent comes fromIssueToJiraExtranetIssue method.
Since this is a jar file by IntellIJ Idea, we find interesting points. In the following piece of code,
Line 422, issueRequest.getMax () is not a desirable practice
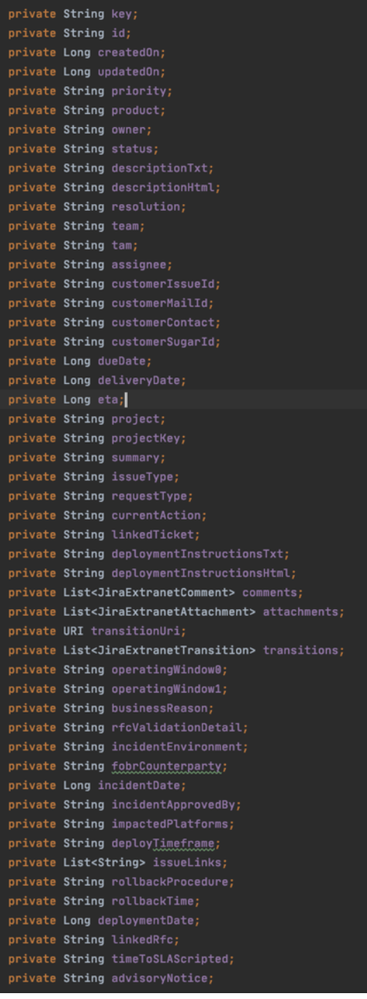
Line 427 points to the jiraExtranetIssue class, which has a huge number of fields.
As a result, the next step was refactoring class fields, review loop.
As optional info, please, checkout the next article.
https://blog.gceasy.io/2019/11/06/memory-wasted-by-spring-boot-application/
https://www.csd.uoc.gr/~hy252/project_old/performance.pdf - this one describe the fundamental steps, of course in the new JDK build better and run in JRE as well.
Next example will be related to the one of apps from the marketplace, once the vendor accepts.
I hope it was interesting, feel free to ask questions


Comments
Post a Comment