How to make it easier to identify wasted memory and identify bad scripts / applications
Hi awesome community,
In this article, I would like to share with you a small tips and tricks related to analyzing heap dump using Yourkit.
First of all, disclaimer: all things should be tested on test environment.
Let's do investigation.
1. You need to take a heap dump. Let's follow https://dzone.com/articles/how-to-capture-java-heap-dumps-7-options
Actually, I use jcmd for take heap_dump. Because jmap is mostly affected my prod instance. ;) Time to time JVisualVM helps to me as well.
2. Then upload to your PC. (scp, rsync, nc)
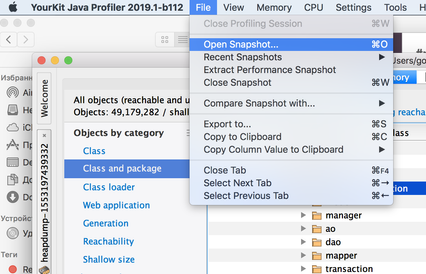
2. Let's Open snapshot
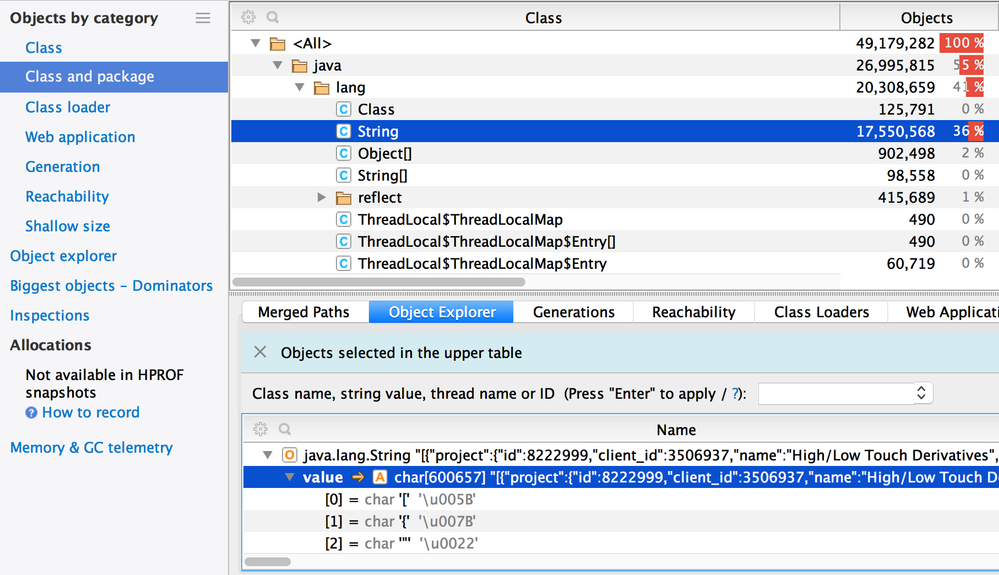
3. Let's click to Class and package in Right Sidebar and check your apps just for double check.
And easier you can investigate your classes and packages. Also, you can see Check which objects mostly used and wasted.
That article helps to me https://dzone.com/articles/preventing-your-java-collections-from-wasting-memo
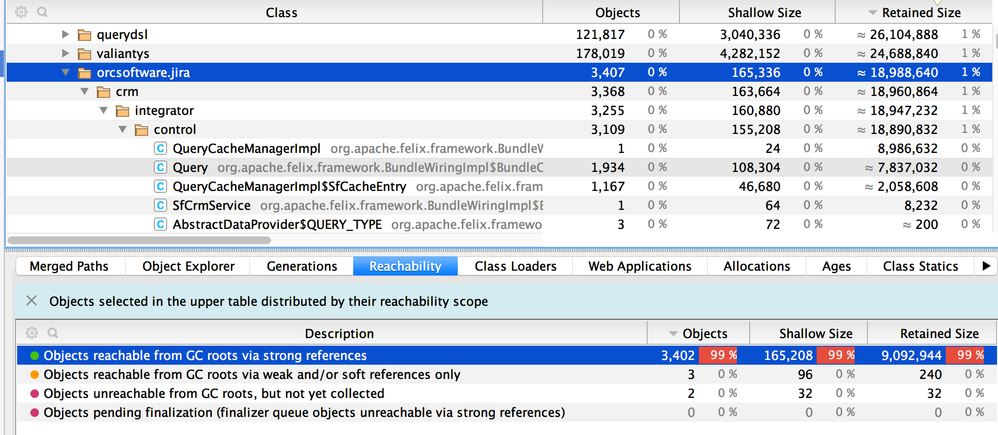
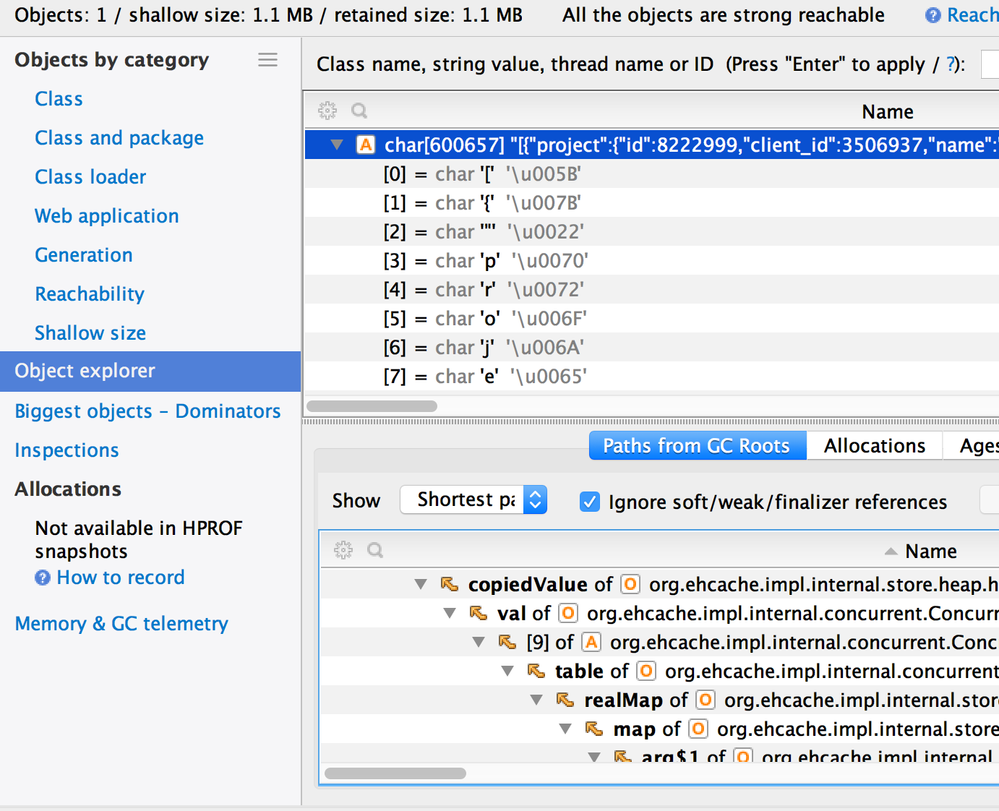
4. Well, let's investigate a biggest objects
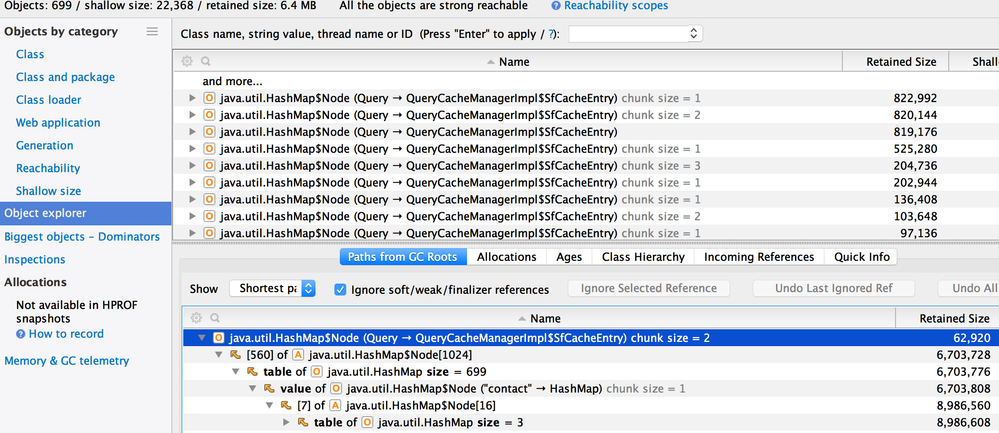
5. Let's investigate what is this? Just click calculate GC root paths.
6. Finally, it was no needed caching which was in app from marketplace.
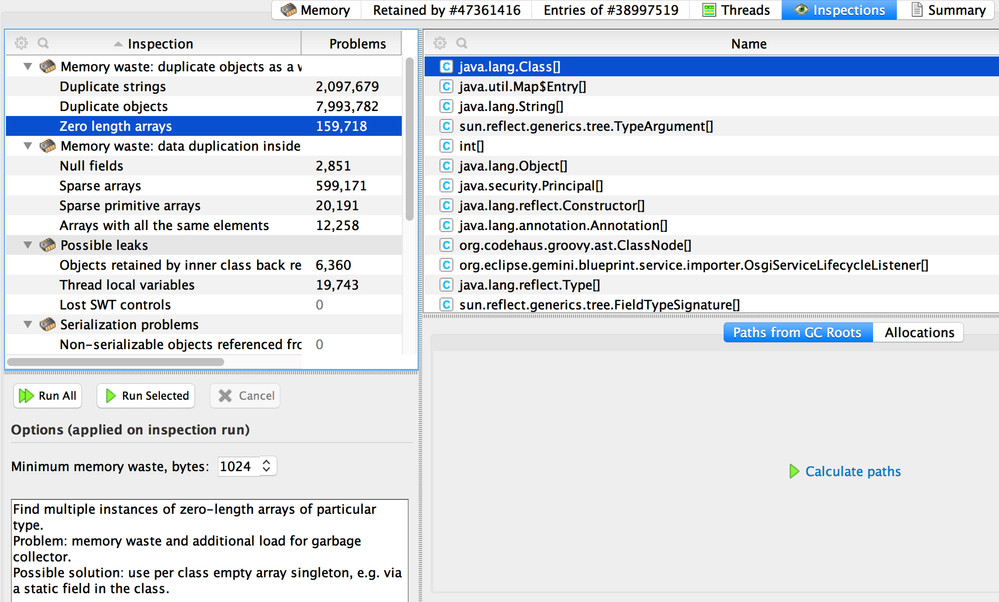
7. Let's review "Inspections" tab. To me it is very interesting area. Because after waiting all calculation you can find wasted data structures in your platform, app from vendor and your apps.
8. Interesting to review your groovy scripts, maybe time to optimize. ;)
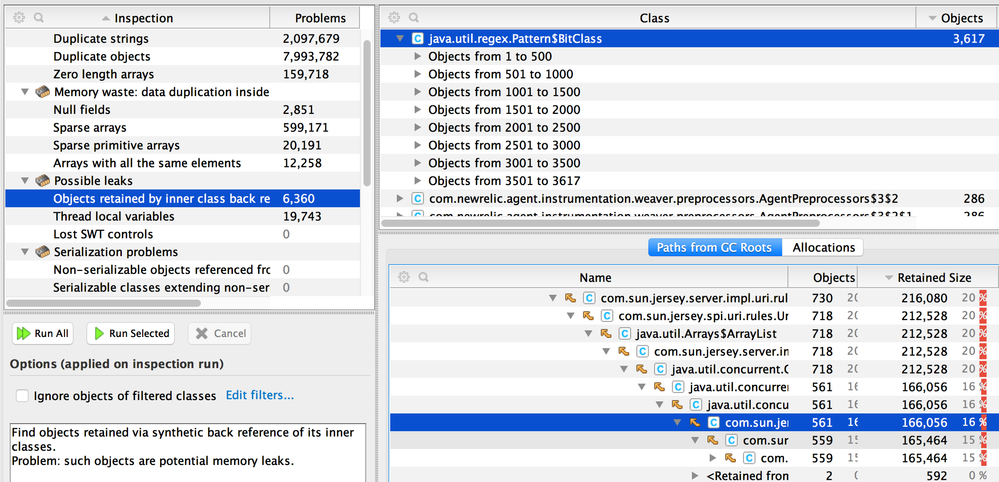
9. Also, I found interesting app which used so much Regex.
A small conlusion:
0. Changed GC strategy
1. Rewrote own app
Using that artile as start https://dzone.com/articles/preventing-your-java-collections-from-wasting-memo , I have changed the initialize the data structure values and change somewhere the data structure. e.g. Somewhere replace Hashmap into ArrayList, or with predictable init size.
2. Noticed a few app vendors about problems.
3. Updates to latest one or reconfigured
4. Completely removed/disabled a few apps
5. Optimized groovy scripts ( a few things was removed)
And last good thing is opening issues with integration starting so faster from 32s to ~ 6s as average. that info based on HAR files from end of users. About searching I can't provide because I don't have metrics. VM resources I can provide also as well.
Thanks
I hope this one will be helpful for you. Next time I will share another story with other tool :)
Cheers,
Gonchik Tsymzhitov

Comments
Post a Comment