Yet another compliance request can initiate additional tests for the LUKS solution
Hi!
Today I would like to share the story about how one of the Jira Service Desk Data Center installations was degraded after increasing the number of users and how to improve work on a low level after you can forget that problem. Where main cause was compliance request a few months ago.
For you it will be interesting to make testing and find out your own choice to meet business requirements.
Shortly, moral of that article do more testing and double check your solutions and inform business.
So let’s start.
We have business requirements:
All files like attachments, and Jira database (PostgreSQL) must have an additional layer of encryption with the AES algorithm.
As a possible solution we did via LUKS, as our setup worked on an RHEL based OS.
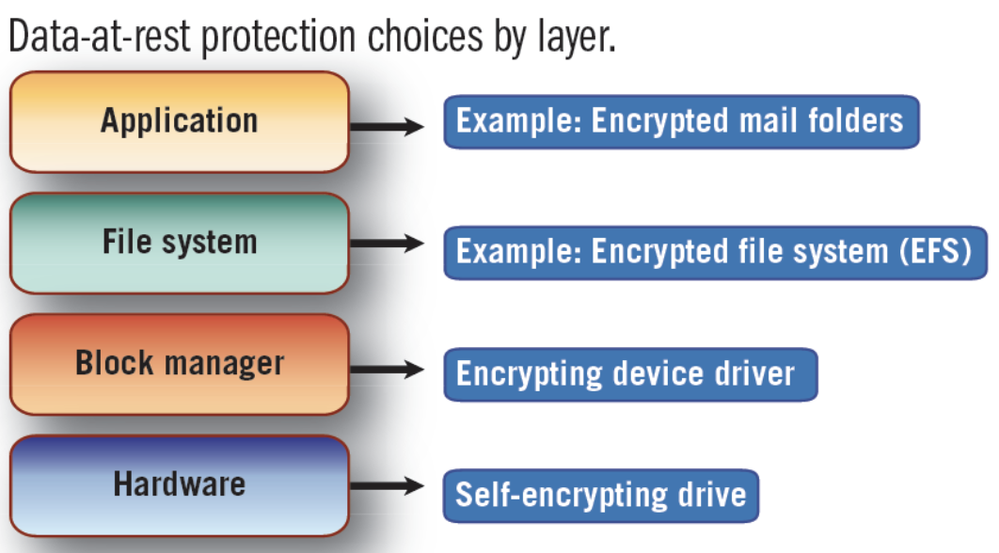
Because it’s quite cheap solution and lower that filesystem, if your sysadmins used a different one.
The best one is hardware level (i.e. NetApp encryption , but sometimes customers want to economy the solution and meet with some IOPS bottlenecks)
Configuration is too easy, but what happens if the number requests (from Jira to Postgres) to write will increase ?
If we have too many UPDATE, INSERT requests, as postgres has AUTOCOMMIT, and once those changes will be synced with disk from memory to disk. As we have requirements to increase the number of customers, we will meet that bottleneck.
How to do testing of that bottleneck and how to improve, I will share my story where one article quite helped me to fix the latency problem.
Used command:
# fio --filename=/dev/mapper/encrypted-ram0 --readwrite=readwrite --bs=4k --direct=1 --loops=1000000 --name=crypt --runtime=60
#ramdisk without enсryption on pgsql server
plain: (groupid=0, jobs=1): err= 0: pid=19842: Sat Mar 27 22:48:09 2021
   read: IOPS=171k, BW=667MiB/s (700MB/s)(169GiB/259953msec)
  write: IOPS=171k, BW=667MiB/s (699MB/s)(169GiB/259953msec)
Run status group 0 (all jobs):
   READ: bw=667MiB/s (700MB/s), 667MiB/s-667MiB/s (700MB/s-700MB/s), io=169GiB (182GB), run=259953-259953msec
  WRITE: bw=667MiB/s (699MB/s), 667MiB/s-667MiB/s (699MB/s-699MB/s), io=169GiB (182GB), run=259953-259953msec
[pgsql]# dmsetup table /dev/mapper/encrypted-ram0
0 8388608 crypt aes-xts-plain64
# crypt luks with ramdisk with exist setup

crypt: (groupid=0, jobs=1): err= 0: pid=20468: Sat Mar 27 22:52:17 2021
   read: IOPS=26.6k, BW=104MiB/s (109MB/s)(4459MiB/42942msec)
  write: IOPS=26.5k, BW=104MiB/s (109MB/s)(4453MiB/42942msec)
Run status group 0 (all jobs):
   READ: bw=104MiB/s (109MB/s), 104MiB/s-104MiB/s (109MB/s-109MB/s), io=4459MiB (4676MB), run=42942-42942msec
  WRITE: bw=104MiB/s (109MB/s), 104MiB/s-104MiB/s (109MB/s-109MB/s), io=4453MiB (4670MB), run=42942-42942msec
Once we just add the flag: --perf=same_cpu_crypt, we will see quite an interesting solution.
[root@]# sudo dmsetup table encrypted-ram0

0 8388608 crypt aes-xts-plain64 0 1:0 0 1 same_cpu_crypt
# test with new flag
[root@pgsql]# fio --filename=/dev/mapper/encrypted-ram0 --readwrite=readwrite --bs=4k --direct=1 --loops=1000000 --name=crypt --runtime=60
   read: IOPS=45.3k, BW=177MiB/s (185MB/s)(14.8GiB/85886msec)
  write: IOPS=45.2k, BW=177MiB/s (185MB/s)(14.8GiB/85886msec)
Run status group 0 (all jobs):
   READ: bw=177MiB/s (185MB/s), 177MiB/s-177MiB/s (185MB/s-185MB/s), io=14.8GiB (15.9GB), run=85886-85886msec
  WRITE: bw=177MiB/s (185MB/s), 177MiB/s-177MiB/s (185MB/s-185MB/s), io=14.8GiB (15.9GB), run=85886-85886msec
In the table we can easier can see how one flag change fully the situation of disks.
Operation | Read IOPS | Write IOPS |
without key | 26.6k | 26.5k |
with same_cpu_crypt | 45.3k | 45.2k |
without any encryprion | 171k | 171k |
To me, quite interesting, how often do you need to encrypt disks for Atlassian products?
P.S. I have been motivated after that article:
https://blog.cloudflare.com/speeding-up-linux-disk-encryption/

Comments
Post a Comment