Stories about detecting Atlassian Confluence bottlenecks with APM tool [part 1]
Hey!
Gonchik, a lover of APM (application performance monitoring) tools, in particular Glowroot, is in touch.
Today I will tell you how to find bottlenecks in Confluence On-Prem in the shortest possible time based on one industrial installation.
We are faced with a situation where a large number of people simultaneously break into the knowledge base on Confluence On-Prem (during the certification), and the Confluence dies for some time.
We immediately thought that the problem is precisely in the simultaneous number of visitors and we can immediately tweak the JVM, but it turned out that not everything is so simple.
Below I will tell you how we found the real cause of the brakes and how we dealt with it.
The main task: to conduct an audit and, on its basis, achieve performance improvements, especially in times of a large number of active users in the system.
Of course, first of all, the hardware resources and OS configurations were checked, where no problems were identified.
However, there were no Nginx access logs, because the configuration disabled logging utilizing the access log-off directive. From the useful, I tweaked the SSL termination, I also connected http2. I didn’t focus on fine-tuning Nginx, because it became clear that we had to go in the direction of Tomcat (vendor recommendations).
Then I had one restart to configure the system, where I installed the Glowroot agent application and went to see the graphs generated by the APM agent (I wrote about how to install it here).
I offer three analyzes at different levels of application management and maintenance, which I found useful and may be of interest to you.
After doing all the above checks, I continued analyzing the DBMS and Confluence connection, since Confluence - Nginx worked fine.
First of all, Glowroot showed that for each request to the database, Confluence checks the state of the connection, as follows:
But the number of status checks is 11 per one useful request, and it takes from 0.20 ms to 0.32 ms for each check. That is, on average, 2 to 3 milliseconds are spent on auxiliary requests. And if we do not have caching at the application level or when caching is invalidated, then this is a bottleneck.
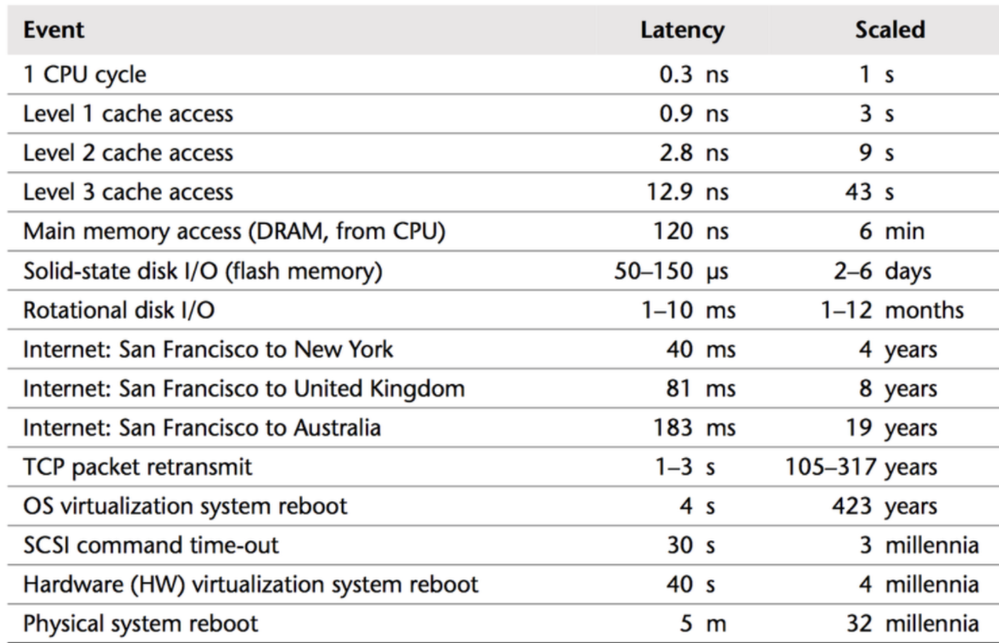
Further, after specifying the DBMS version and driver version using the following link https://{CONFLUENCE_URL} /admin/systeminfo.action, there was room for thought. Especially thanks to the good old delays plate, as it always helps me to identify bottlenecks by eye.
The Atlassian vendor is actively using PostgreSQL, which is confirmed by the page on supported DBMS.
Since I am still using MySQL, updating the driver has traditionally reduced my symptoms. The article “After updating the online database, there is a problem of excessive rollback of database transactions” helped me to understand the reasons, where the solution was switching to another puller (https://github.com/alibaba/druid/wiki/FAQ). In my case, switching to PostgreSQL.
If you want to see how the useSessionStatus parameter works, you can download the connector and check the use of the isReadOnly method.
Зависимость версии легко проверить, посмотрев первое условие в методе.
In summary, the short-term solution is to take risks and update the DBMS connector driver, while the long-term solution is to migrate to PostgreSQL 11.
to be continued.
Cheers,
Gonchik


Comments
Post a Comment