Stories about detecting in my Atlassian Confluence instance bottlenecks with APM tool [part 2]
Gonchik, a lover of APM (application performance monitoring) tools, in particular Glowroot, is in touch. This is the second story related to observing Confluence with Glowroot. (First is here)
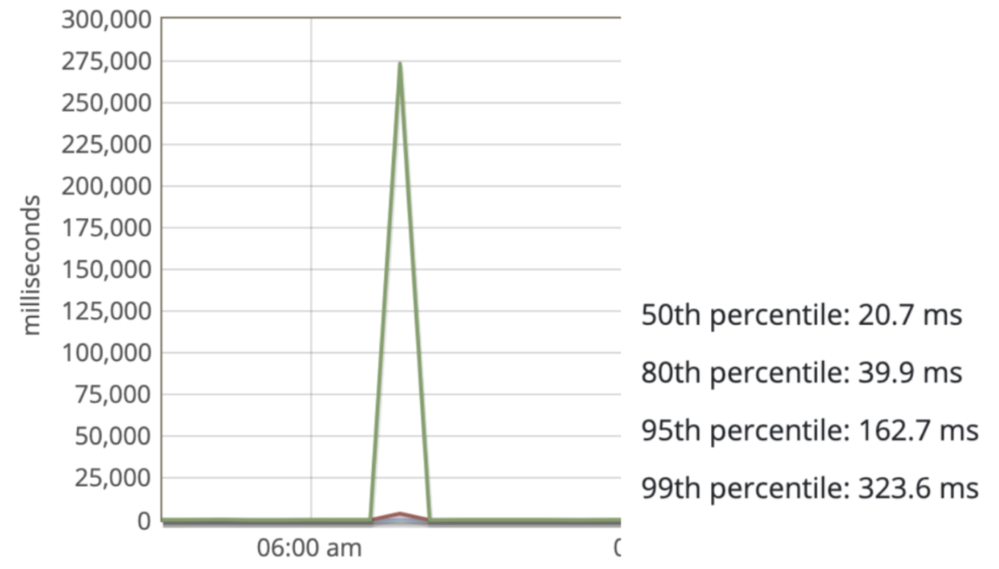
Often, analysis is helped by looking for patterns such as time of complaints and correlation with application response time graphs, especially in percentiles, which gives an understanding and clarity of what is happening with a small volume of requests.
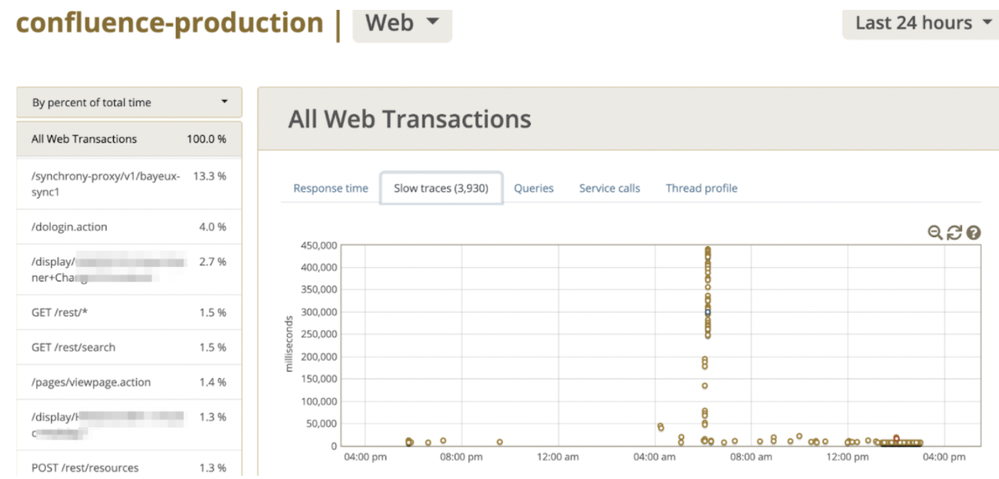
By switching to slow traces mode in the Glowroot dashboard, you can take a closer look at the behavior of the system.
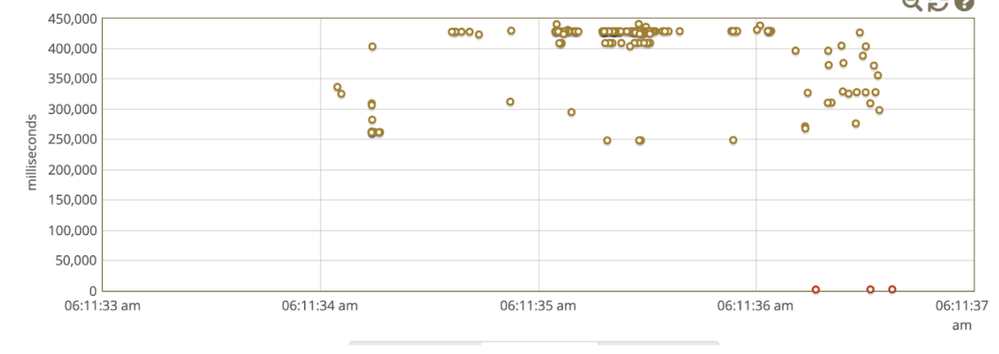
and also in the specified screenshot, I observed the following behavior:
All this prompted me to view the schedule of batch operations, for example, the time when the backup process was started.
First of all, I checked in the web interface ({CONFLUENCE_URL} /admin/scheduledjobs/viewscheduledjobs.action) and disabled backups in xml at the application level. You can also see the launch history, and, in principle, understand that the BackUp Confluence batch job ends just at 6:30 am.
But as soon as, logged in as root, I checked the crontab, where I also saw that the backup script starts at 5 am and ends at about 6:15 am my PC time. Since this is a classic bottleneck, the way out is simply a shutdown due to its unnecessary. Due to the fact that at the virtualization level, backups are performed once an hour, and the DBMS is located on another server, the most important thing is the Confluence home directory.
Let's summarize. Simple reasons should always be checked. The backup schedule is the first thing to check if the system behavior should somehow correlate with the problem.
Have a good day!


Comments
Post a Comment