Efficiently Managing Jira Assets: Detecting and Cleaning Up Duplicated History Records
Maintaining a clean and efficient Jira installation, especially in an On-Prem setup, involves meticulous data management. A common issue faced by administrators is the duplication of history records for assets in Jira, which can lead to database bloat and performance issues. Duplications often stem from situations such as stuck imports, automated processes running recursively, or incorrect manual imports. This article will guide you through the process of detecting and cleaning up duplicated records, with an emphasis on solutions contributed by the Jira community.

Understanding the Issue
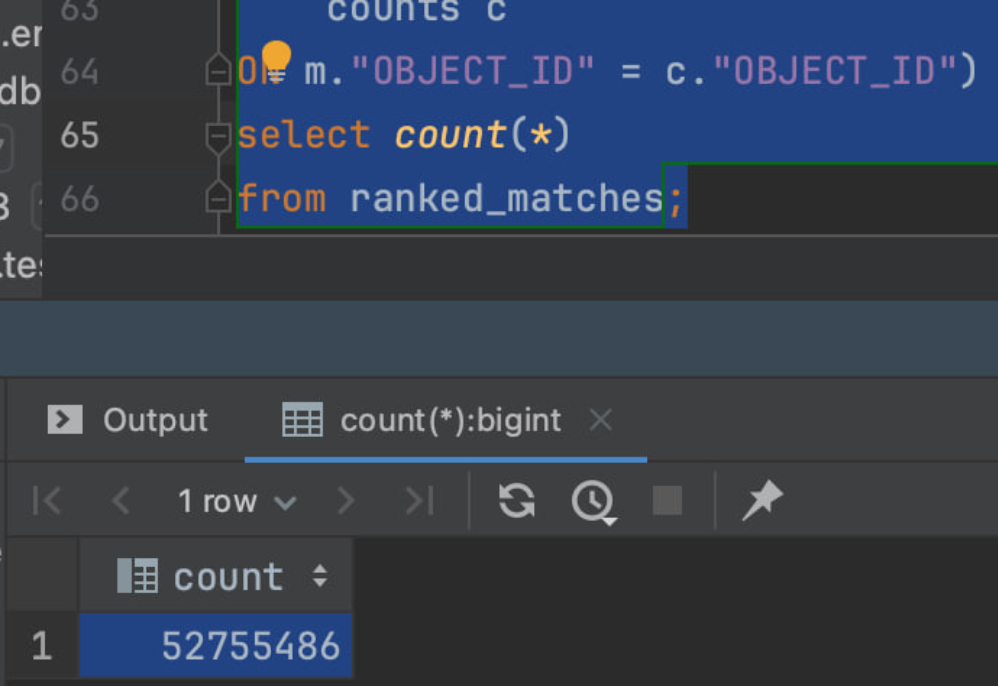
Duplicated history records can severely impact the performance of your Jira instance. As history records accumulate, database queries slow down, and system memory usage increases disproportionately. In one notable case, duplications reached a staggering 52 million records, prompting an urgent need for cleanup.
Detecting Duplicated Records
Artem Tumanov, a valuable contributor to the Jira community, has shared an efficient SQL script that can help in identifying duplicated history records. You can find this script on GitHub:

Using the Script
1. Download the Script: Access the script from the provided GitHub link.
2. Run the Script: Execute it in your Jira database to generate a report of duplicated records.
Cleaning Up Duplicated Records
Once the duplicated records are identified, the next step is cleanup. Fortunately, Artem has also provided a script designed for this purpose:
• Cleanup Duplicated History Records Script
Cleanup Process
1. Download the Cleanup Script: Access the script from GitHub.
2. Execute the Script: Run the cleanup script in your Jira database environment.
Example of a Real Cleanup
Here’s a practical example to illustrate the process:
• Before cleanup, the database had a total of around 940 million records, with approximately 52 million identified as duplicates.
• The following removal runs were observed:
[2024–03–12 04:29:56] 81,423 rows affected in 12 s 318 ms
[2024–04–13 06:23:09] 1,463,094 rows affected in 1 m 40 s 131 ms
[2024–04–13 06:26:47] 3,648,899 rows affected in 5 m 29 s 930 ms
[2024–04–13 06:42:20] 49,517 rows affected in 34 s 812 ms
• Post-cleanup, the database size reduced to approximately 800 million records, effectively addressing the issue of incorrect imports.
Impact on Performance
The cleanup had a significant positive impact on system performance, notably:
• Pre-cleanup, each cluster node required 128 GB of RAM.
• Post-cleanup, the same nodes operated efficiently with 96 GB of RAM, as indicated by Grafana metrics.
Conclusion
Regular analysis and cleanup of your Jira data are essential practices for maintaining system performance and ensuring reliable operation. Key takeaways include:
• Schedule quarterly data analysis to identify and rectify issues proactively.
• Regularly monitor and correct incorrect configurations.
• Inform the software vendor about recurring problems to explore systemic solutions. Additionally, consider options like Data Center solutions for better problem management.
By following these steps, you can ensure your Jira installation remains efficient and scalable, ready to tackle the challenges posed by data growth and system complexity.
Comments
Post a Comment