Posts

How to detect the issue of CPU spike for Tableau cluster on Linux

  Hi! Today I would like to share how I am detecting the problem of CPU spikes. This morning we had a few CPU spikes. So let’s check uptime 10:19:23 up 116 days, 12:13, 1 user, load average: 0.36, 0.81, 2.57 dmesg --human | tail -n 50 [Dec30 16:15] audit: type=1327 audit(1703952955.024:85698311): proctitle=”/var/opt/tableau/tableau_server/data/tabsvc/services/backgrounder_0.20231.23.0806.1229/bin/run-backgrounder” [ +0.631996] audit: type=1327 audit(1703952955.024:85698311): proctitle=”/var/opt/tableau/tableau_server/data/tabsvc/services/backgrounder_0.20231.23.0806.1229/bin/run-backgrounder” [ +0.002027] audit: type=1300 audit(1703952955.029:85698312): arch=c000003e syscall=42 success=yes exit=0 a0=47 a1=7f5bb5d4b5c0 a2=10 a3=6f8da items=0 ppid=91808 pid=67952 auid=4294967295 uid=991 gid=1087000453 euid=991 suid=991 fsuid=991 egid=1087000453 sgid=1087000453 fsgid=1087000453 tty=(none) ses=4294967295 comm=”pool-29-thread-” exe=”/opt/tableau/tableau_server/packages/bin.20231.23.0806...
Jira Cloud migration survey to make a comprehensive plan

Image
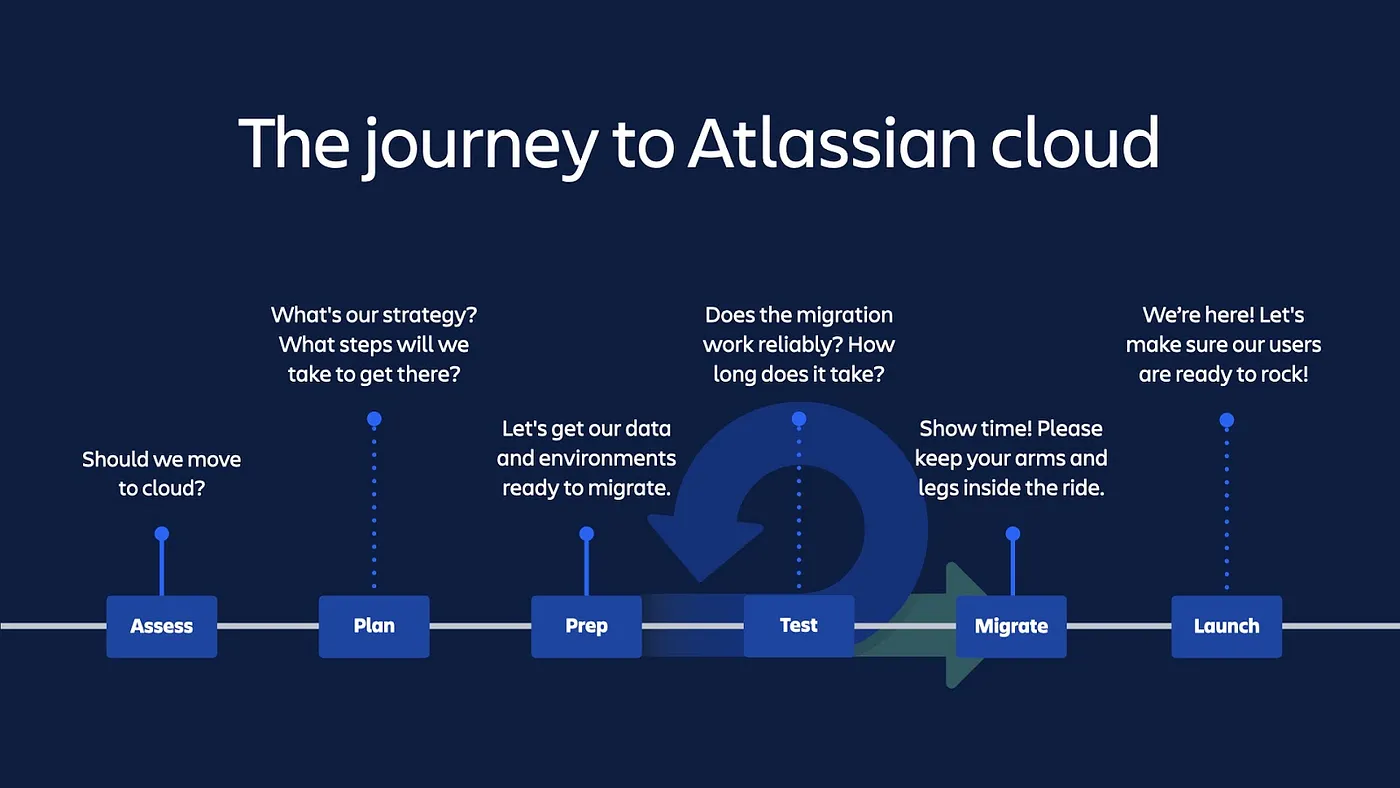
Last 3 years (till Feb, 2024), I used a number of questions to migrate from Jira Server to Jira cloud to make migration go smoothly.  And Of course I used that resources like Migration plan (Complex Cloud migrations)) And Cloud migration guide , and that information with my checklist many migrations passed, of course the first migrations were complicated, today I would say migration to cloud is smooth and easily :) So please read and use my checklist for your migration if you don’t migrate yet. Migrating from a Jira Server instance to Jira Cloud Enterprise is a significant project that requires careful planning and consideration. Below is a list of categories with corresponding questions that you should address in your migration plan to ensure a smooth transition: Pre-Migration Planning What specific outcomes are we hoping to achieve by transitioning to Jira Cloud Enterprise? Can we outline a detailed migration roadmap with milestones, deadlines, and a timeline for the entire proce...

Stories about detecting in my Atlassian Confluence instance bottlenecks with APM tool [part 2]

Image
  Gonchik, a lover of APM (application performance monitoring) tools, in particular Glowroot, is in touch. This is the second story related to observing Confluence with Glowroot. (First is   here ) Often, analysis is helped by looking for patterns such as time of complaints and correlation with application response time graphs, especially in percentiles, which gives an understanding and clarity of what is happening with a small volume of requests. By switching to slow traces mode in the Glowroot dashboard, you can take a closer look at the behavior of the system.   and also in the specified screenshot, I observed the following behavior:   All this prompted me to view the schedule of batch operations, for example, the time when the backup process was started. First of all, I checked in the web interface ({CONFLUENCE_URL} /admin/scheduledjobs/viewscheduledjobs.action) and disabled backups in xml at the application level. You can also see the launch history, and, in pri...

Stories about detecting Atlassian Confluence bottlenecks with APM tool [part 1]

Image
  Hey! Gonchik, a lover of APM (application performance monitoring) tools, in particular Glowroot, is in touch. Today I will tell you how to find bottlenecks in Confluence On-Prem in the shortest possible time based on one industrial installation. We are faced with a situation where a large number of people simultaneously break into the knowledge base on Confluence On-Prem (during the certification), and the Confluence dies for some time. We immediately thought that the problem is precisely in the simultaneous number of visitors and we can immediately tweak the JVM, but it turned out that not everything is so simple. Below I will tell you how we found the real cause of the brakes and how we dealt with it. The main task: to conduct an audit and, on its basis, achieve performance improvements, especially in times of a large number of active users in the system. Of course, first of all, the hardware resources and OS configurations were checked, where no problems were identified. Howev...

Истории о том, как с помощью APM инструмента найти узкие места в Atlassian Confluence

Image
  Привет!  На связи Гончик, любитель APM (application performance monitoring) инструментов, в частности Glowroot .  Сегодня расскажу о том, как за кратчайшее время найти узкие места в Confluence On-Prem на основе одной промышленной инсталляции.  Мы столкнулись с ситуацией, когда большое количество людей одновременно ломится в базу знаний на Confluence On-Prem (во время сдачи аттестации), и конфлюенс умирает на какое-то время. Сразу подумали, что проблема именно в одновременном количестве посетителей и сразу можно затюнить JVM, но оказалось, что не все так однозначно. Ниже расскажу, как мы нашли реальную причину тормозов и как с ней справились. Основная задача: провести аудит и на его основе добиться улучшения производительности, особенно в моменты большого количества активных пользователей в системе.  Конечно, в первую очередь были проверены ап паратные ресурсы, конфигурации ОС, где никаких проблем не выявлено.  Однако, отсутствовали access логи nginx, поск...
